
India’s Power Sector
As on 31.03.2025
Target for FY 2025-26
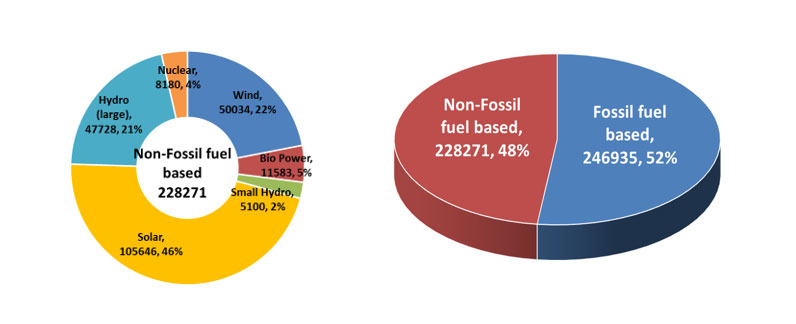
Installed Power Generation Capacity:
Fossil fuel based: 2,46,935MW
Non-Fossil fuel based: 2,28,271MW
Installed Power Generation Capacity:
Conventional: 12,860MW
AC Transmission Lines: 4,94,374ckm
HVDC : 19,375 ckm
765 KV : 56,955ckm
400 KV : 2,06,792ckm
220 KV : 2,11,252ckm
AC Transmission Lines: 24,400ckm
HVDC : NIL
765 KV : 12,865ckm
400 KV : 5,933ckm
220 KV : 5,602ckm
AC Substation Transformation Capacity:
12,47,488 MVA
HVDC: 32,500 MW
765 KV : 2,99,819 MVA
400 KV : 4,72,376 MVA
220 KV : 4,75,293MVA
AC Substation Transformation Capacity:
197617MVA
HVDC : NIL
765 KV : 1,03,000MVA
400 KV : 62,150MVA
220 KV : 32,467MVA
Power Sector
- India stands 4th globally in Renewable Energy Installed Capacity (including Large Hydro), 4th in Wind Power capacity & 4th in Solar Power capacity.
- India is the third-largest producer and consumer of electricity worldwide, with an installed power capacity of 4,75,206 MW as on Mar 25.
Summary of Distribution Infrastructure Planned (As on March 2022 and March 2030)
Sr
Description
Unit
March-22
March-22
%age Increase
1
Substation Count (66/33/22 KV)
Nos
39,965
52,157
31%
2
Substation Capacity (66/33/22 KV)
MVA
4,82,810
6,24,332
39%
3
Feeders (66/33/22 KV)
No
36,804
54,639
48%
4
Feeders (66/33/22 KV)
CKM
5,89,304
7,77,994
32%
5
Feeders (11 KV) Nos
NOS
2,30,979
3,23,899
40%
6
Feeders (11 KV) Length
CKM
49,35,279
59,03,782
20%
7
Distribution Tranformer (DT) Count
NOS
1,46,74,261
1,93,32,115
32%
8
Distribution Tranformer (DT)
MVA
6,89,192
9,27,656
35%
9
LT Feeders (1-Ph & 3Ph)
CKM
79,45,758
97,74,634
23%
10
Capacitor Bank
MVAR
59,255
1,05,209
78%
11
Consumer (in Crores)
Nos
33
52
58%
Growth Drivers
- Higher investments: As per the National Infrastructure Pipeline 2019-25, energy sector projects accounted for the highest share (24%) out of the total expected capital expenditure of Rs. 111 lakh crore (US$ 1.4 trillion). Total FDI inflow in the power sector reached US$ 16.58 billion between April 2000-March 2023.
- Policy support: Electrification in the country is increasing with support from schemes like Deen Dayal Upadhyay Gram Jyoti Yojana (DDUGJY), Ujwal DISCOM Assurance Yojana (UDAY), and Integrated Power Development Scheme (IPDS).
530 GW of renewable energy capacities to be achieved by 2030
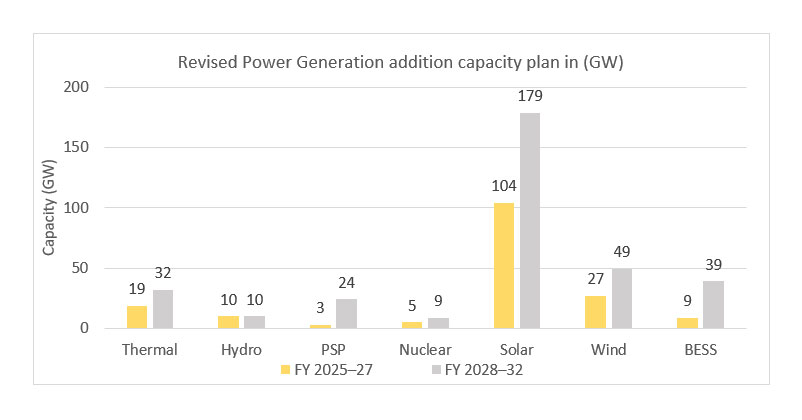
- As per National Electricity Plan, projected capacity during 2022-27 for conventional & RE sources will be 211,819 MW comprising 31,880 MW of Conventional capacity (Coal-25,580MW and Nuclear-6,300MW) and 179,939 MW of Renewable based Capacity (Large Hydro- 10,462 MW, Solar-131,570, Wind-32,537 MW, Biomass-2,318 MW, Small Hydro352MW PSP-2700 MW) excluding likely Hydro based Imports of 3720MW. The likely BESS requirement is 8,680MW/34,720 MWh during this period.
- Based on generation planning studies the likely Installed Capacity for the year 2026-27 will be 9,591 MW comprising of 273,038 MW of Conventional capacity (Coal- 235,133MW, Gas–24,824MW, Nuclear-13,080MW) and 336,553 MW of Renewable based Capacity (Large Hydro-52,446 MW, Solar-185,566 MW Wind-72,895 MW, Small Hydro-5,200 MW Biomass- 13,000MW, PSP-7446MW) along with BESS capacity of 8,680MW/34,720 MWh.
Grid Scale Battery Storage
- Production of 4,000 MWh of battery storage
- Grid scale Battery storage to reach at 142 Gwh by 2032
- Battery Energy Storage system (BESS) capacity based on RE Generation and transmission system for integration: 47 GW by 2030
EV Charging Infrastructure
- 30% EV by 2030; 80% for two and three wheelers, 70% for commercial cars, 30% for private cars, 40% for buses, and 2.5% for commercial vehicles
- EV Charging Infrastructure after every 25 KM and set up 60,000 charging stations.
- Total estimated EV Chargers by 2030 – 8.95 crs; (94% Private/ Home charges & 58 Lakhs Public chargers)
- 529 GWH – 207 GWH (EV) and 322 GWH (Stationary)
Additional domestic demand drivers
- Indian Railways have a big ambitious plan of building & electrification of about 7,000 Route Kilo Meters (RKM) with an investment of over Rs. 8,000 crs in the next 2 years.
- Smart infrastructure consists of an outlay for Smart city of Rs. 1 trillion and Urban metro network of 1,600 route KM
- Defence sector is also opening for electrical & allied electronics sector procurement from the overall expected outlay of over Rs. 80,000 crs.
Cross sectoral demand will also enhance due to capex growth in core sectors like cement, petrochemicals, metals, data centers, Realty/ buildings etc. in addition to agriculture etc.
Electrical Industry: Indian Electrical and Allied Electronics industry is dominated by T&D segment contributing approx. 65% of the total industry size
% Growth index for Electrical Equipment Industry
Product
FY 23
FY 24
FY 25
Rotating Machines
5.7
3.6
10.2
LV Switchgear
6.1
13.7
14.8
HV Switchgear
-5.5
27.7
16.8
Cables
19.4
23.6
7.8
Power Transformer
13.8
11.8
34.8
Distribution Transformer
21.1
32.8
8.7
Capacitors
-8.3
11.7
-1.6
Energy Meters
15.0
11.4
73.7
Transmission Line Tower
-5.0
16.5
13.8
Conductors
34.4
2.1
4.1
Insulator
-1.9
9.5
7.0
Instrument Transformer
9.6
15.5
128.4
Surge Arrester
-16.9
1.3
-4.1
Overall Growth Index
13.2
17.5
14.1
5200
13080
235133
24824
609591
8,680
Transmission equipment:
- Demand for Transmission equipment covering Transmission line towers, for 400 KV and above. New generation Conductors ( High ampacity conductors) shown growth with increase in the share of the total production.
- Insulators have shown growth mainly for Long rod and Hollow Composite Insulators whereas Surge Arrester showing overall decline of about 4% due to decline in exports however stagnant in domestic orders. Both growths seen for MV and HV segment
Sub-station equipment:
- Growth in High voltage switchgears is mainly from HV & EHV GIS and MV AIS segment with RMUs; mostly from domestic demand coming from state utilities and CPSUs for increasing the sub-station network.
- Good growth for Distribution Transformers supported by RDSS and other scheme and for Power Transformer for increasing the sub-station network in line with the 33GW power Generation capacity addition in FY 25.
- All Power Cables segment, specially EHV, are witnessing a growth due to renewed domestic demand including for railways with support of increased export orders. LD / HW Cables are stagnant.
- HT Capacitors shown decline in production due to low domestic demand however LT Capacitors are stagnant.
Distribution equipment:
- Energy Meters, especially, Smart and prepaid meters are in demand for domestic consumption.
- Low Voltage switchgear has continued its growth trend from last year growth due to sustained demand from Realty, Infrastructure & other manufacturing industries as well as exports.
- Rotating Machines segment stagnant shown growth for FHP and HT Motors, LT Motors are shown slight growth. In LT induction motors more than 99% are energy efficient motors, increase in share of I3 and above motors
Electrical Industry – Import and Export
- The Market has grown at a CAGR of 15% in 5 years
- The total imports have increased by 15% over last year and has a (34%) percentage of Market size.
- The total equipment exports of the country have grown with a 5-year CAGR of 13% and imports have grown at a CAGR of 15% (in Rs terms). However, India’ share in World’s Export still < 1%.
- Major products exported – Power Electronics, Switchgear & Panels, Transformers & TLT
- Exporting Countries – USA, Germany, UAE, UK, France
- Imports for Power Electronics, Transformers & parts, LV & HV Custom built products, Rerating Machines etc
- China still accounts for about 34% share in Imports followed by Germany and Singapore
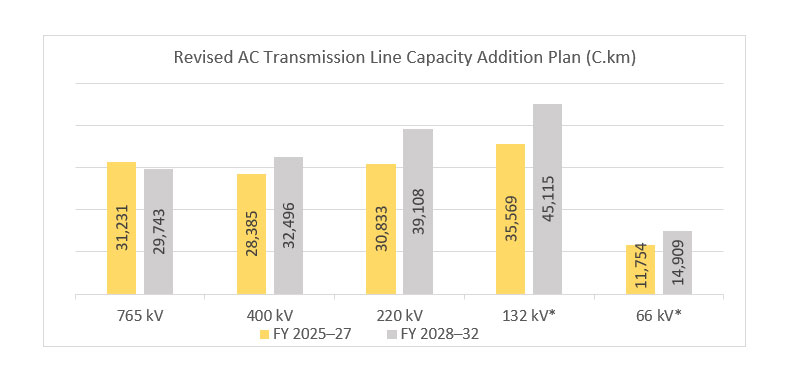
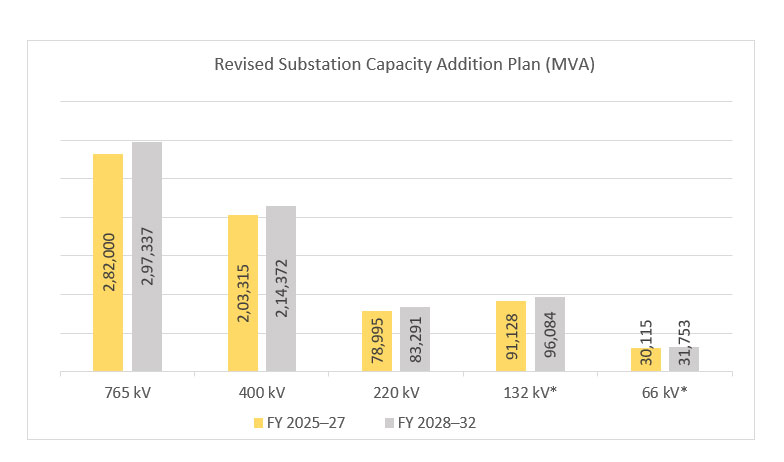
Voltage class
Transmission line
substation
Unit
Likely addtion
Unit
Likely addition
HVDC
ckm
4300
MW
12000
765KV
ckm
35005
MVA
319500
400KV
ckm
38245
MVA
268135
400KV
ckm
38245
MVA
268135
230/220kv
ckm
46027
MVA
123305
Total Transmission Line
ckm
123577
MVA/MW
722940
Transmission Line and Substations under ISTS & Intra-state capacity addition planned in 2022-27
Type
Unit
Under ISTS
Under Intra-state
Total
Substation
MVA
426675
284265
710940
Transmission Line
ckm
53132
70445
123577
Distribution
- SUMMARY OF DISTRIBUTION INFRASTRUCTURE PLANNED (AS ON MARCH 2022 AND MARCH 2030)
Source : CEA
INDUSTRY UPDATES
- April to December 2025
- April to September 2025
- April to June 2025
- April to March 2025
- April to March 2024
- April to December 2023 FY23
- April to September 2023 HYFY24
- April to June 2023 FY24
- April to March 2022-23 FY23
- April to March 2022-23
- April to December 2021-22
- April to September 2021-22
- April to June 2021-22
- April to March 2020-21
- April to December 2020-21
- April To September 2020-21
- April To March 2019-20
- April to December 2019-20
- April To September 2019-20
- April To June 2019-20
- April To March 2018-19
- April To January 2018-2019
- April To September 2018-2019
- April to March 2017-2018
- April to January 2017-2018
- April To September 2017-18
- April To June 2017-18
- April to March 2016-17
- April to December 2016-2017
- April to September 2016-2017
India’s Power Sector
Sr
Description
Unit
March-22
March-30
%age Increase
1
Substation Count (66/33/22 KV)
Nos
39,965
52,157
31%
2
Substation Capacity (66/33/22 KV)
MVA
48,2810
62,4332
29%
3
Feeders (66/33/22 KV) Count
No
36,804
54,639
48%
4
Feeders (66/33/22 KV) Length
CKM
59,9304
77,7994
32%
5
Feeders (11KV) Nos
Nos
230979
323899
40%
6
Feeders (11KV) Length
CKM
49,35,279
59,03,782
20%
7
Distribution Transformer (DT) Count
Nos
1,46,74,261
1,93,32,115
32%
8
Distribution Transformer (DT)
MVA
6,89,192
9,27,656
35%
9
LT Feeders (1-Ph & 3Ph)
CKM
79,45,758
9774634
23%
10
Capacitor Bank
MVAR
59,255
1,05,209
78%
11
Consumers (in Crores)
Nos
33
52
58%
Electrical Industry
Representing about 7.2% of the total manufacturing segment in India’s GDP and 45% share in Capital Goods Sector; The electrical and allied electronics industry accounts for over 2.2 million job.
The industry production has grown at about 9.5% CAGR over past 5 years.
Indian Electrical and Allied Electronics industry is dominated by T&D segment contributing approx. 65% of the total industry size
% Growth index for Electrical Equipment Industry
Product
FY 22
FY 23
FY 24
Rotating Machines
24.0
5.7
3.6
LV Switchgear
25.7
6.1
13.7
HV Switchgear
56.1
-5.5
28.9
Cables
21.4
19.4
23.6
Power Transformer
-4.4
13.8
11.8
Distribution Transformer
-4.9
21.1
32.8
Capacitors
35.6
-8.3
11.7
Energy Meters
10.9
15.0
11.5
Transmission Line Tower
0.9
-5.0
16.5
Conductors
-1.3
34.4
2.1
Insulator
-11.5
-1.9
9.5
Instrument Transformer
12.0
9.6
15.5
Surge Arrester
13.1
-16.9
1.3
Overall Growth Index
17.1
13.2
17.6
Transmission equipment
- Demand for Transmission equipment covering Transmission line towers and Conductors ( High ampacity conductors) is seen with pick up in Export orders.
- Insulators have shown growth mainly for Long rod and Hollow Composite Insulators whereas Surge Arrester overall stagnant. Domestic sales for Polymer Surge Arresters shown growth of 75%; decline of about 30% in exports.
Sub-Station equipment
- Growth in High voltage switchgears is mainly from HV & EHV GIS and MV AIS segment; mostly from domestic demand coming from state utilities and CPSUs for increasing the sub-station network.
- Good growth for Distribution Transformers supported by RDSS scheme and around 10% growth in Power Transformers
- LV and MV & HV Power Cables are witnessing a growth of about 23% due to renewed domestic demand including for railways with support of increased export orders. LD / HW Cables are in demand due to pick up in infrastructure projects.
- HT Capacitors production has grown by with sizable growth in Exports however LT Capacitors are slightly down due to quiet domestic demand.
Distribution equipment
- Energy Meters, especially, Smart prepaid meters are in demand for domestic consumption as well as Exports.
- Low Voltage switchgear has continued its growth trend from last year growth due to sustained demand from Realty, Infrastructure & other manufacturing industries as well as exports.
- Rotating Machines segment stagnant over last year’s high growth. LT Motors are shown slight growth however decline for HT Motors. In LT induction motors more than 97% are energy efficient motors.
Electrical Industry – Import and Export
The total equipment exports of the country have grown with a 5 yr. CAGR of 14% and imports have grown at a CAGR of 9% (in Rs terms).
Major products exported – Rotating Machines, Power Electronics, LV Switchgear & Panels, Cable & TLT
- Top Exporting Countries – USA, UAE, Germany, UK, Australia
- Imports increased by 7% in last year especially for Power Electronics, Capacitors, LV & HV Custom built products, Rotating Machines etc.
- China still accounts for about 35% share in Imports followed by Germany and Japan
Source : CEA
Source : CEA
INDUSTRY UPDATES
- April to December 2025
- April to September 2025
- April to June 2025
- April to March 2025
- April to March 2024
- April to December 2023 FY23
- April to September 2023 HYFY24
- April to June 2023 FY24
- April to March 2022-23 FY23
- April to March 2022-23
- April to December 2021-22
- April to September 2021-22
- April to June 2021-22
- April to March 2020-21
- April to December 2020-21
- April To September 2020-21
- April To March 2019-20
- April to December 2019-20
- April To September 2019-20
- April To June 2019-20
- April To March 2018-19
- April To January 2018-2019
- April To September 2018-2019
- April to March 2017-2018
- April to January 2017-2018
- April To September 2017-18
- April To June 2017-18
- April to March 2016-17
- April to December 2016-2017
- April to September 2016-2017